


Hot Stories


Recent Stories


How Can You Enhance Financial Trading Through The Help of Indicators?
Posted by Thandiubani on Mon 13th Mar, 2023 - tori.ngSome traders prefer trading without any indicators. Instead, they use price action to predict market moves. While others make good use of different indicators.
In case you are still in search for a trading system that best fits your personality and needs, it’s best to learn about different indicators and how to use them properly. Once you understand how indicators work, you can start creating trading strategies, and demo test them or backtest them to see what works and what doesn’t.
Indicator categories
There are two main types of indicators: leading and lagging. Leading indicators are predictive and signal traders where price might go next. Lagging indicators improve visualization. Lagging indicators do not predict future price movements. However, both lagging and leading indicators are critical in technical analysis.
Every indicator is built for a certain purpose. For instance if you use trend trading indicators in a ranging market or vice versa, the indicator will produce a lot of false signals. In terms of their purpose there are four major indicator categories:
- Trend trading indicators – lagging
- Mean reversion indicators – lagging
- Momentum indicators – leading
- Volume indicators – can be both: lagging or leading
In addition, there are indicators that help traders make timely decisions. For instance candle timer indicator is best suited for intraday candlestick traders as the indicator tells when the next candle will open. You can find out more about the indicator here. Be noted that the indicator is made for MetaTrader 4 platform.
Trend trading indicators
As the name suggests, trend trading indicators are made for trending markets. Traders must first identify market conditions. When price is moving in a range, trend trading indicators will not work. Most traders use moving averages to trade trends. The most popular trend indicators are:
- The Moving Average Convergence Divergence (MACD) – this indicator consists of two moving averages. When the two moving averages make a crossover, traders get reversal signals in a trend. MACD is also a popular momentum indicator.
- Simple Moving Average (SMA)
- Exponential Moving Average (EMA) – EMA is more practical and precise for day traders and other trader types as the indicator puts more emphasis on recent price movements in the calculations' formula.
- Trend trading indicators help traders find entries and exits in a bull or bear market. It should be noted that once traders identify trends they need to make sure trends are not near exhaustion.
Mean reversion indicators
Mean reversion indicators display the length of a price swing before a counter impulse initiates a retracement. The theory behind the indicator assumes that after an extreme price move, asset prices tend to return to normal or average levels. In financial trading this theory not only applies to asset prices but also company earnings, volatility, earnings growth rates, etc.
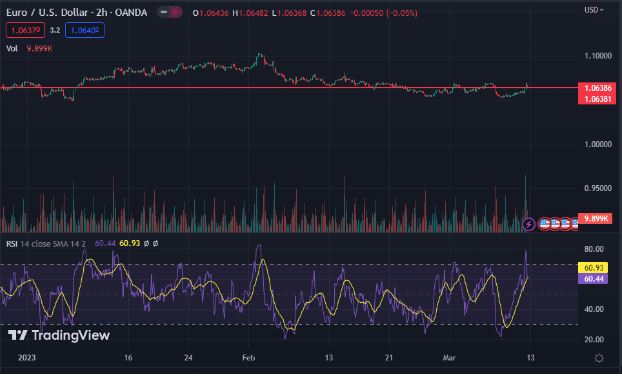
One of the most popular reversion indicators is Relative Strength Index (RSI). RSI is created for measuring speed and size in price change. Traders use this indicator to identify whether an asset is overbought or oversold.
14 days RSI is standard for trading platforms, however, traders can increase or decrease the number of days according to their preferences. Relative strength is calculated by dividing average gains by average losses. The indicator oscillates between 0 and 100. RSI includes two horizontal lines for overbought and oversold levels. The upper line shows overbought conditions and the lower displays oversold. When indicator value gets above the overbought condition, it is likely that the price will reverse. And vice versa. However, it should be noted that prices can remain in overbought and oversold conditions for a long time. The main dangers of using the RSI is that market news or trending markets can produce a lot of false signals.
Momentum indicators
Regardless of the direction in which the price moves, momentum indicators reflect how the price moves over given periods of time and how strong those movements are. Momentum indicators are a leading type, this means that they help traders by predicting future moves.
Imagine throwing an object in the sky. The speed will increase from start, then will slow down and reverse direction. The same logic is behind creating momentum indicators. The momentum indicators can be used in combination with other indicators and strategies.
The Moving Average Convergence Divergence (MACD) is one of the most popular momentum indicators. The indicator is built for following trends and producing entry and exit signals. The indicator is typically used by position traders, swing traders and intraday traders, as it can be effectively used on various timeframes.
MACD is made of two lines that oscillate. These lines often cross each other. And then go up or down together for large periods. The blue line is called a MACD line and the value is calculated by dividing the longer term Exponential Moving Average (EMA) by shorter term EMA. The red line in the indicator is the signal line. The signal line uses additional EMA in its calculations. The most common one is the 9 period EMA. When MACD crosses above the signal line, we have a bullish signal. And when the MACD crosses below the signal line, we have a bearish signal.
Instead of lines, the MACD can also be represented as a histogram. Each bar represents the distance between the MACD line and the Signal line. When the MACD line is above the signal line, green bars are created. And when the MACD line is below the signal line, red bars are created. The bigger the bars, the stronger the trend.
MACD indicator seems very easy to use at first glance. Just wait for the crossover and enter the market to catch a potential new trend. However, the indicator is not intended for trading ranging and choppy markets. And as a result will produce lots of false signals. In order to increase the likelihood of success, traders first identify trends, and wait for MACD crossover signals to only trade in the major trend direction.

Volume indicators
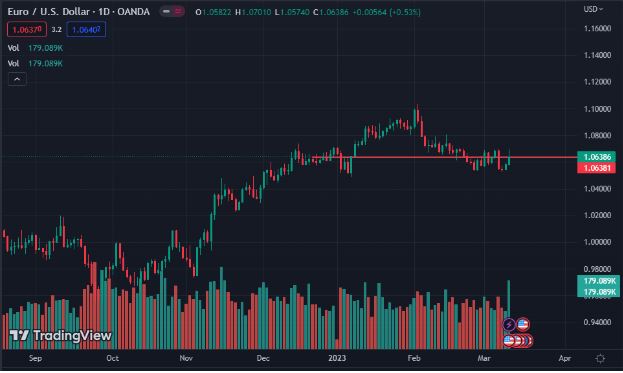
Volume indicators show rise and fall in interest for given assets for a given period of time. For instance, an increase in volume means that more trade orders are executed. It should be noted that volume is calculated differently in stocks and in the FX market. Stock market is a centralized market, and therefore it’s easier to show the exact volume of Stocks traded. Forex is a decentralized market and that means that traders can buy currency pairs on one exchange and sell on another. This makes calculating the exact number of volumes an impossible goal. Instead, FX volume indicators measure the rise and fall in tick moves and trade activity. Volume indicators have multiple uses. Most commonly traders use them to predict breakouts, trend continuations or reversals. The increase in trade activity is represented by an increase in bar sizes. If the price is rising, we have green bars. When the price is falling, bars are red.
- Breakouts – volume indicators are highly useful in predicting breakouts from significant levels. For example, if price is at a significant level or at pattern completion level and volume increases, it means that there’s enough energy required to break out from the resistance. And consequently, the likelihood of price breaking out from the significant level increases. In the similar situation, low volume signals that it’s likely that breakout will not happen.
- Trend continuations – volume indicators help measure strength of a trend. When a market is trending and volume is high, this means that there’s enough energy in the market for the trend to continue. And when the opposite is true, low volume may be a predictor of trend reversal. For this very reason, volume indicators are often used for finding exit points in trending markets for active trade orders.
When you should ignore signals from indicators
Indicators are fully technical. This means that they do not take into account market data. In addition, trading is an activity where lots of different kinds of investors, companies and organizations participate. They all use different timeframes to make trade decisions. In order to protect themselves from false signals, technical traders avoid placing orders before and during major news announcements. It is best to always keep an eye on the economic calendar when trading purely technical.
Summary
To sum everything up, some traders prefer to trade without the help of indicators. However, others find indicators very useful. The best way to know if trading using indicators is worth a try is to learn how to use them and test your trading strategies. Indicators come in all shapes and forms. The most popular ones can be categorized in four main groups:
- Trend trading indicators – lagging
- Mean reversion indicators – lagging
- Momentum indicators – leading
- Volume indicators – can be both: lagging or leading
It’s important to note that each indicator is built for a certain purpose. For instance, using trend trading indicators in a ranging market will result in an unsatisfactory outcome. It’s critical to learn what exactly each indicator shows and which markets are optimal for their usage.
Top Stories


Stories from this Category


Recent Stories